Executive Summary Dashboard
The Executive Summary dashboard provides a comprehensive view of your compliance program, combining organization lifecycle metrics, trail activity, and operational status into a single view.
Program Overview
The top section displays high-level metrics about your program.
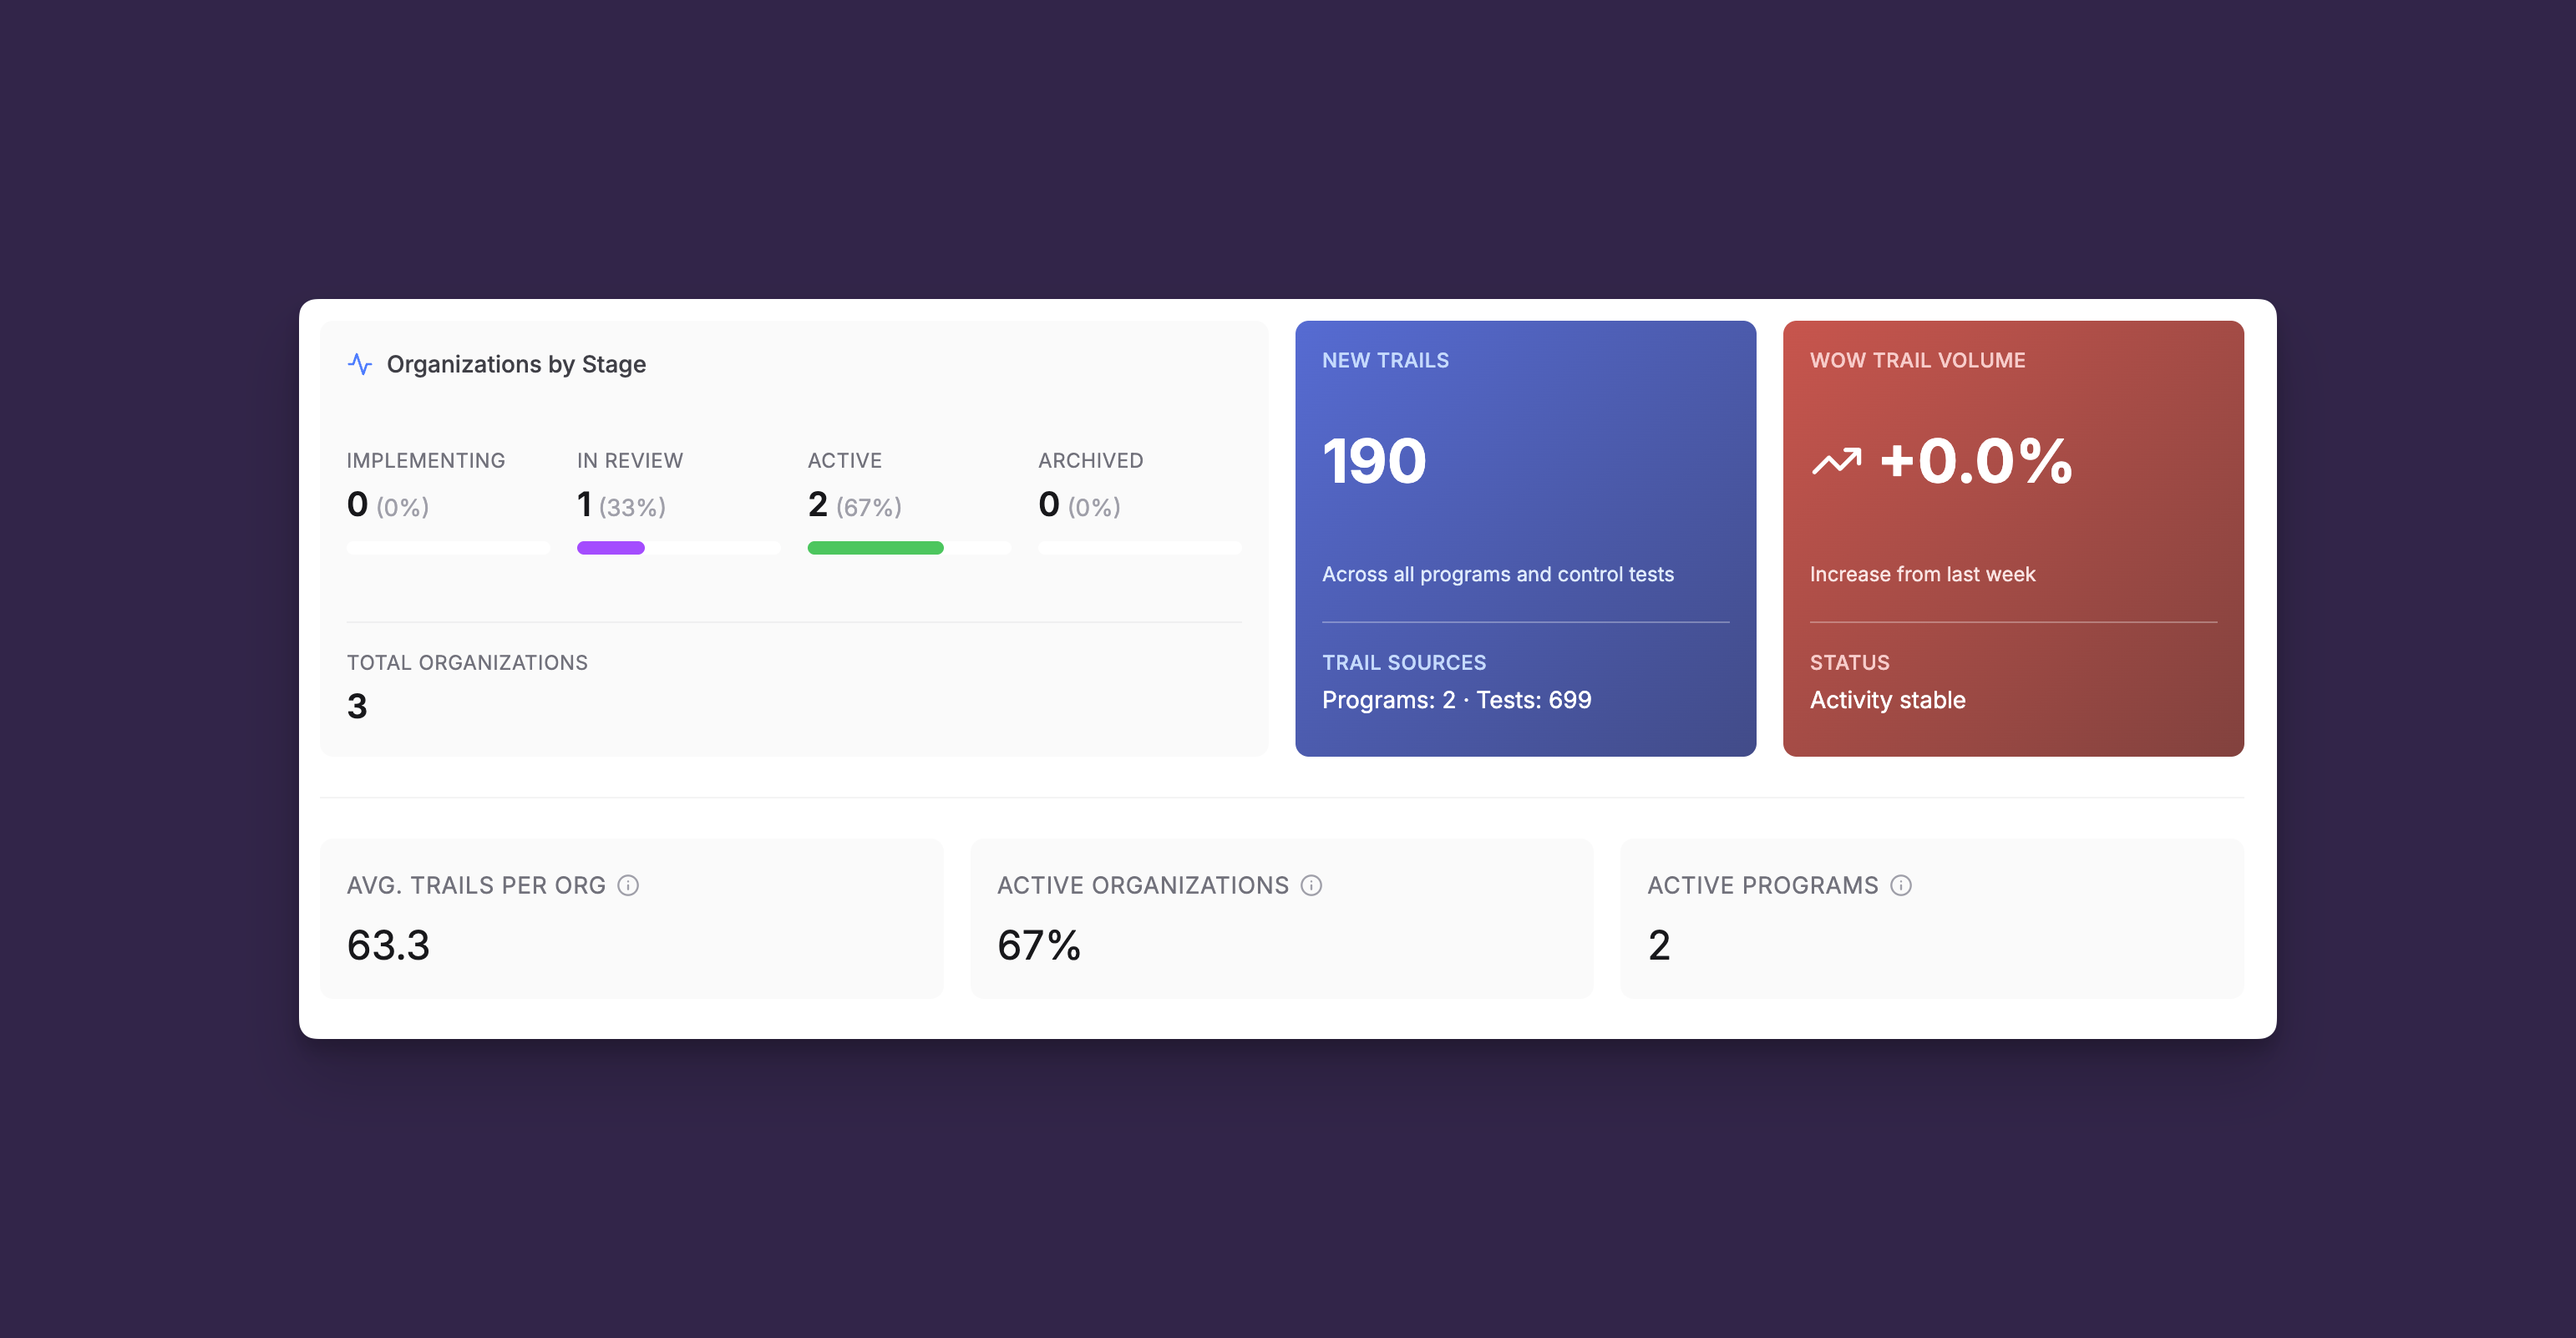
Organizations by Stage
Track where your organizations are in the compliance lifecycle:
- Implementing - Organizations actively onboarding and setting up their compliance program
- In Review - Organizations with completed setup, pending final approval
- Active - Fully onboarded organizations with live compliance monitoring
- Archived - Inactive or offboarded organizations
The total count shows all organizations in your program (excluding Sandbox environments).
New Trails
The New Trails card shows the total number of compliance trails created across your program within the selected time period.
Key metrics:
- New Trails count - Total trails raised across all programs and control tests
- Trail Sources - Breakdown showing number of active programs and tests generating trails
💡 Tip: A sudden increase in new trails may indicate a data quality issue or new control being enforced. Use this metric to trigger deeper investigation.
Week-over-Week Trail Volume
Monitor trend direction with the WoW (Week-over-Week) comparison:
- Green (decreasing) - Trail volume is trending down, indicating improving compliance
- Red (increasing) - Trail volume is trending up, requiring attention
The percentage shows the change from the previous 7-day period compared to the current 7-day period.
Stats Row
Three summary statistics provide quick program insights:
Operational Activity
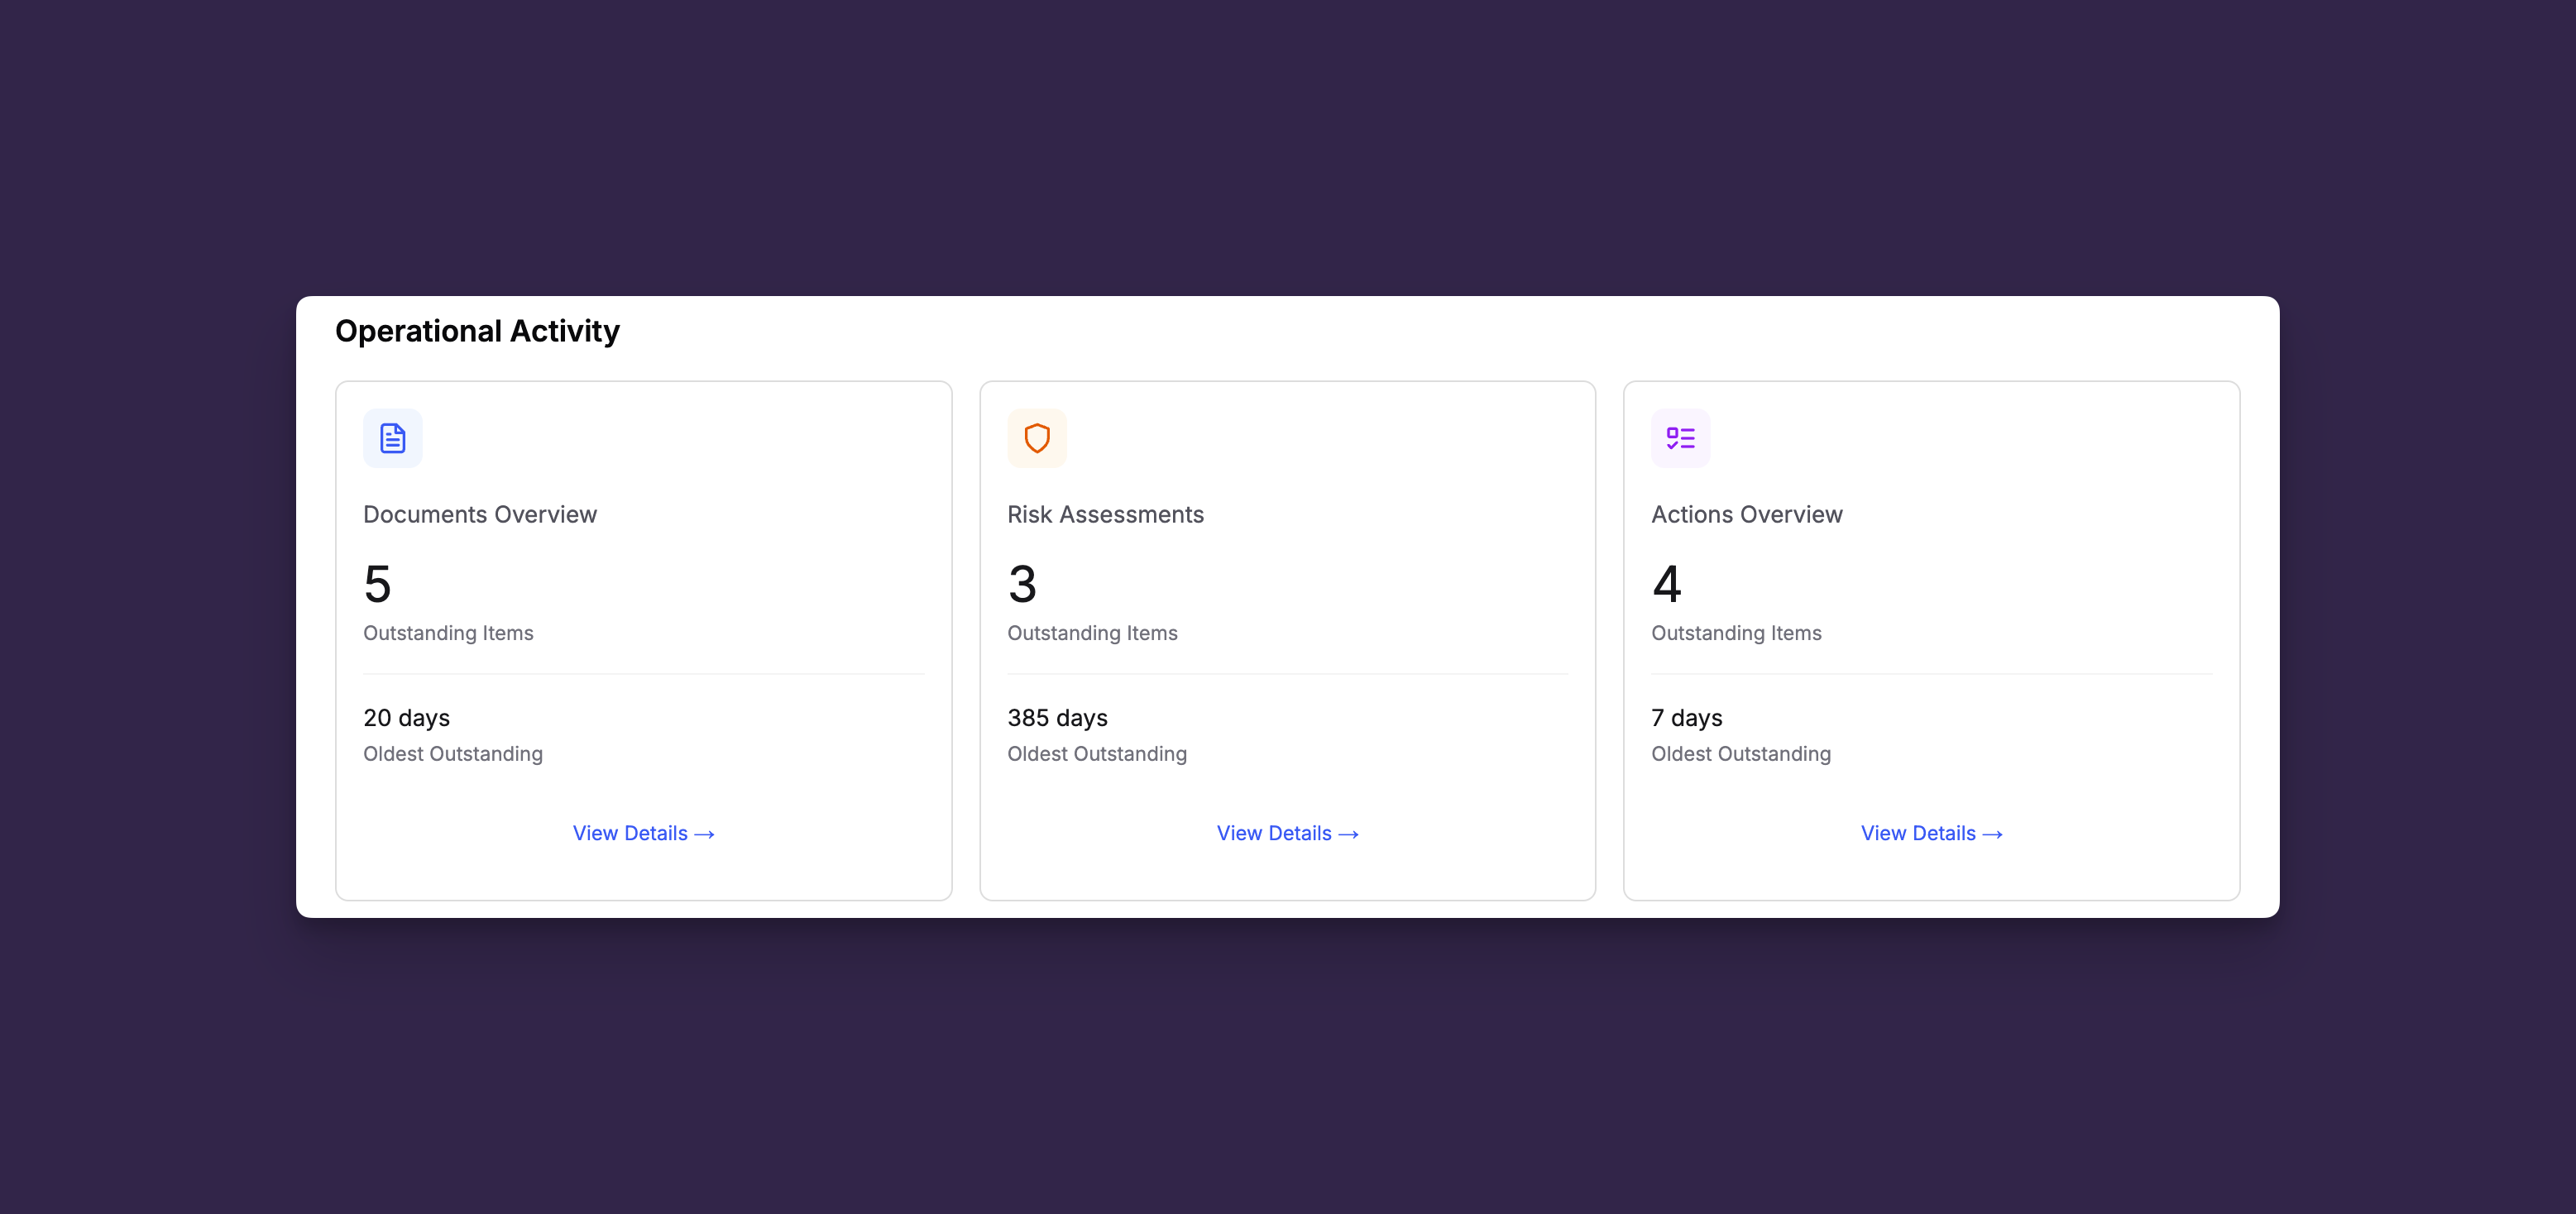
The Operational Activity section highlights outstanding work across three key areas: Documents, Risk Assessments, and Actions.
Each component displays the same two metrics:
- Outstanding Items - Count of items awaiting completion or review
- Oldest Outstanding - Days since the oldest open item was created
Clicking any component navigates to its detailed view with your current filters applied.
The displayed counts update based on the organization and framework filters selected at the top of the dashboard, allowing you to quickly assess operational status for specific organizations.
💡 Tip: Monitor the “Oldest Outstanding” metrics to identify stalled work items that may need escalation or reassignment.